“A city is what it is because its citizens are what they are.” (PLATO)

Stacks Image 1009

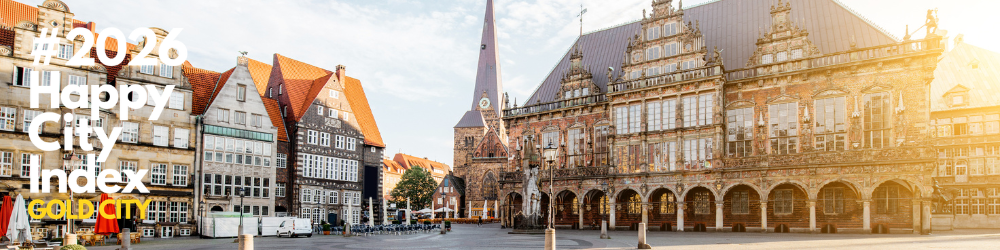
BREMEN (rank 27) - Germany

About the data

Methodology

How to read these results

The Happy City Index is an independent comparative research project based on a structured methodology and multi-source data assessment. The results presented here are provided for informational and benchmarking purposes only and should not be treated as a definitive or exhaustive statement of fact.

  • Scores compare each city with the average across all cities in the Index.
  • For important decisions, verify relevant data with official sources.
Read the published methodology →

Spotted a mistake?

Help us improve the Index

We have made every effort to ensure reliable and comparable data. Still, errors may occur. If you notice something that should be corrected, let us know.

By doing so, you can also join us as a one-time contributor and become part of our global community of researchers.

  • 1 · Report
  • 2 · We verify
  • 3 · Index improves
Report a correction →

Source: Institute for Quality of Life, Happy City Index 2026.

Happy City Index 2026 · City profile

Bremen against the Index average

Results for all 64 indicators, grouped into six themes: citizens, governance, environment, economy, health and mobility.

Total score6482
CategoryGold
Above the average32/51
Policies in place13/13

Results by theme

Share of indicators in each theme where Bremen scores above the average or has the policy in place.
Citizens70%Governance65%Environment100%Economy60%Health67%Mobility75%50%

All 64 indicators at a glance

One square per indicator, ordered by theme. Hover for details.

32 above average13 policies in place16 below average3 neutral
7of 10
Citizens
11of 17
Governance
7of 7
Environment
6of 10
Economy
8of 12
Health
6of 8
Mobility

01Selected results

EnvironmentRecycling rate
70%
Index average: 44%
CitizensUrban innovation ecosystem potential
208
Index average: 86
HealthPsychiatrists per 100,000 inhabitants
27.5
Index average: 16.4
EnvironmentGreen mobility share
60%
Index average: 45%
CitizensResidents who speak a foreign language
56%
Index average: 34%
GovernanceHousing affordability ratio (price to income)
3.1
Index average: 5.1
EnvironmentLandfill waste burden
0.14
Index average: 0.28
GovernanceTurnout in the last local elections
59.6%
Index average: 49.8%
HealthPaid vacation days a year
30
Index average: 21.5
BremenIndex average

02Largest differences from the average

Ahead of the average

  • GDP Growth (%)
    10× avg0.20% vs 0.02%
  • Urban Innovation Ecosystem Potential
    2.4× avg208.24 vs 86.02
  • Distance to the Nearest International Airport
    100% lower0 vs 21.44
  • Cost of Higher Education Compared to Average Annual Salary
    100% lower0% vs 0.07%
  • Population Aged 65+ Benefiting from Municipal Home Care (%)
    +95%20.5% vs 10.51%
  • Presence of a Globally Ranked Higher Education Institution
    71% lower81 vs 276.16
  • Psychiatrists per 100,000 Inhabitants
    +68%27.50 vs 16.38
  • Youth Unemployment Ratio
    67% lower0.8 vs 2.46

Behind the average

  • Net Internal Migration Rate per 1,000 Population
    negative-5.10 vs 3.58
  • Homeless People per 10,000 Residents
    2.0× avg10.58 vs 5.27
  • Annual Average Unemployment Rate
    2.0× avg11.2% vs 5.58%
  • Parks per km²
    −89%0.12 vs 1.09
  • Businesses per 1,000 Residents
    −70%41.13 vs 138.18
  • Paid Parental Leave Weeks at 50% or More of Salary
    −42%14 vs 24.21
  • Patents per 100,000 Inhabitants
    −39%109.92 vs 178.84
  • Cultural Institutions per 100,000 Residents
    −33%5.5 vs 8.15
  • Libraries per 10 km²
    −22%0.91 vs 1.16

03All indicators

BremenOverall averageAbove averageBelow average

Citizens

7 above avg.2 below avg.10 indicators
Urban Innovation Ecosystem Potential
BRE208.24
AVG86.02
Above average
School Density
BRE0.24
AVG0.71
Below average
Higher Education Accessibility
In place
Presence of a Globally Ranked Higher Education Institution
BRE81
AVG276.16
Above average
Cost of Higher Education Compared to Average Annual Salary
BRE0%
AVG0.07%
Above average
Residents with a Master's Degree (%)
BRE12.1%
AVG12.40%
Below average
Population Able to Communicate in a Foreign Language (%)
BRE56.0%
AVG34.14%
Above average
Use of Electronic Banking Services (%)
BRE82.25%
AVG79.27%
Above average
Population Aged 65+ Benefiting from Municipal Home Care (%)
BRE20.5%
AVG10.51%
Above average
Homeless People per 10,000 Residents
BRE10.58
AVG5.27
Below average

Governance

11 above avg.4 below avg.17 indicators
Availability of City Website
BRE1
AVG2.11
Below average
Net Internal Migration Rate per 1,000 Population
BRE-5.10
AVG3.58
Below average
Pupils per School Building
BRE462.85
AVG380.04
Above average
Employment in Creative Industries (%)
BRE4.55%
AVG4.62%
Below average
Housing Affordability Ratio
BRE3.13
AVG5.12
Above average
Housing Affordability Ratio (Rent)
BRE19%
AVG32.32%
Above average
Cultural Institutions per 100,000 Residents
BRE5.5
AVG8.15
Below average
Libraries per 10 km²
BRE0.91
AVG1.16
Below average
Voter Turnout in the Last Local Elections (%)
BRE59.6%
AVG49.79%
Above average
Open Data Portal Availability
In place
Datasets Available in Machine-Readable Formats
In place
Fault Reporting System via Website or Mobile App
In place
Electronic Payments for Municipal Services
In place
Online Appointment Booking with City Hall
In place
Up-to-Date Official Development Strategy
In place
Key Elements Included in the Strategy
BRE5
AVG4.5
Above average
AI Awareness in City Strategies
In place

Environment

7 above avg.0 below avg.7 indicators
Annual Average PM2.5 Concentration
BRE9.00
AVG11.86
Above average
Green Mobility Share (%)
BRE60.0%
AVG45.25%
Above average
Waste Generated per Resident
BRE0.47
AVG0.51
Above average
Population Served by Sewage Treatment Facilities (%)
BRE99.79%
AVG95.46%
Above average
Recycling Rate (%)
BRE70%
AVG44.29%
Above average
Landfill Waste Burden
BRE0.141
AVG0.28
Above average
Biodiversity Protection Strategy
In place

Economy

6 above avg.4 below avg.10 indicators
GDP per Capita
BRE42,194 GBP
AVG36,208 GBP
Above average
GDP Growth (%)
BRE0.20%
AVG0.02%
Above average
Patents per 100,000 Inhabitants
BRE109.92
AVG178.84
Below average
Businesses per 1,000 Residents
BRE41.13
AVG138.18
Below average
City Fiscal Power Index
BRE32.56%
AVG25.56%
Above average
Annual Average Unemployment Rate
BRE11.2%
AVG5.58%
Below average
Annual Average Youth Unemployment Rate
BRE8.4%
AVG12.44%
Above average
Youth Unemployment Ratio
BRE0.8
AVG2.46
Above average
Percentage Deviation in Earnings Relative to the National Average
BRE70%
AVG43.01%
Above average
Paid Parental Leave Weeks at 50% or More of Salary
BRE14
AVG24.21
Below average

Health

8 above avg.4 below avg.12 indicators
Psychiatrists per 100,000 Inhabitants
BRE27.50
AVG16.38
Above average
Mental Health or Well-Being Strategy
In place
Strategy to Prevent and Address Hate Speech or Cyberbullying
In place
Licensed Medical Doctors Practising in the City (FTE)
BRE5.87
AVG5.18
Above average
Population Covered by Medical Insurance (%)
BRE100%
AVG97.69%
Above average
Intentional Homicides per 100,000 Residents
BRE13.65
AVG20.62
Above average
Adults Classified as Overweight or Obese (%)
BRE53.5%
AVG52.29%
Below average
Parks per km²
BRE0.12
AVG1.09
Below average
Green Space per Capita
BRE58.04
AVG72.57
Below average
Average Weekly Working Hours
BRE40.2
AVG40.52
Above average
Average Number of Paid Vacation Days
BRE30
AVG21.51
Above average
Life Expectancy at Birth
BRE79.43
AVG81.26
Below average

Mobility

6 above avg.2 below avg.8 indicators
Accessibility of Electronic Payment Systems in Transport
BRE2
AVG2.51
Below average
Distance to the Nearest International Airport
BRE0
AVG21.44
Above average
Access Modes to the Nearest Airport
BRE4.00
AVG3.17
Above average
Public Transport Ridership per Capita
BRE184.00
AVG193.80
Below average
Accessible Public Transport Fleet (%)
BRE100%
AVG91.18%
Above average
Road Traffic Accidents per 1,000 Residents
BRE4.51
AVG8.13
Above average
Open Public Transport Data Availability
In place
Integrated Journey Planner Availability
In place

Note: bars are scaled separately for each indicator. For indicators where a lower value is preferable, such as unemployment or PM2.5, a lower result is counted as above average. Differences in section 02 are relative to the Index average; bars are capped at 150%.
Source: Institute for Quality of Life, Happy City Index 2026.

We use cookies on all our websites to gather anonymous data to improve your experience of our websites and serve relevant ads that may be of interest to you. Please refer to the Privacy Policy to find out more. By continuing, scrolling the page or clicking a link, you agree to the use of cookies.